Centralized Logging on Kubernetes with Fluentd, Elasticsearch and Kibana
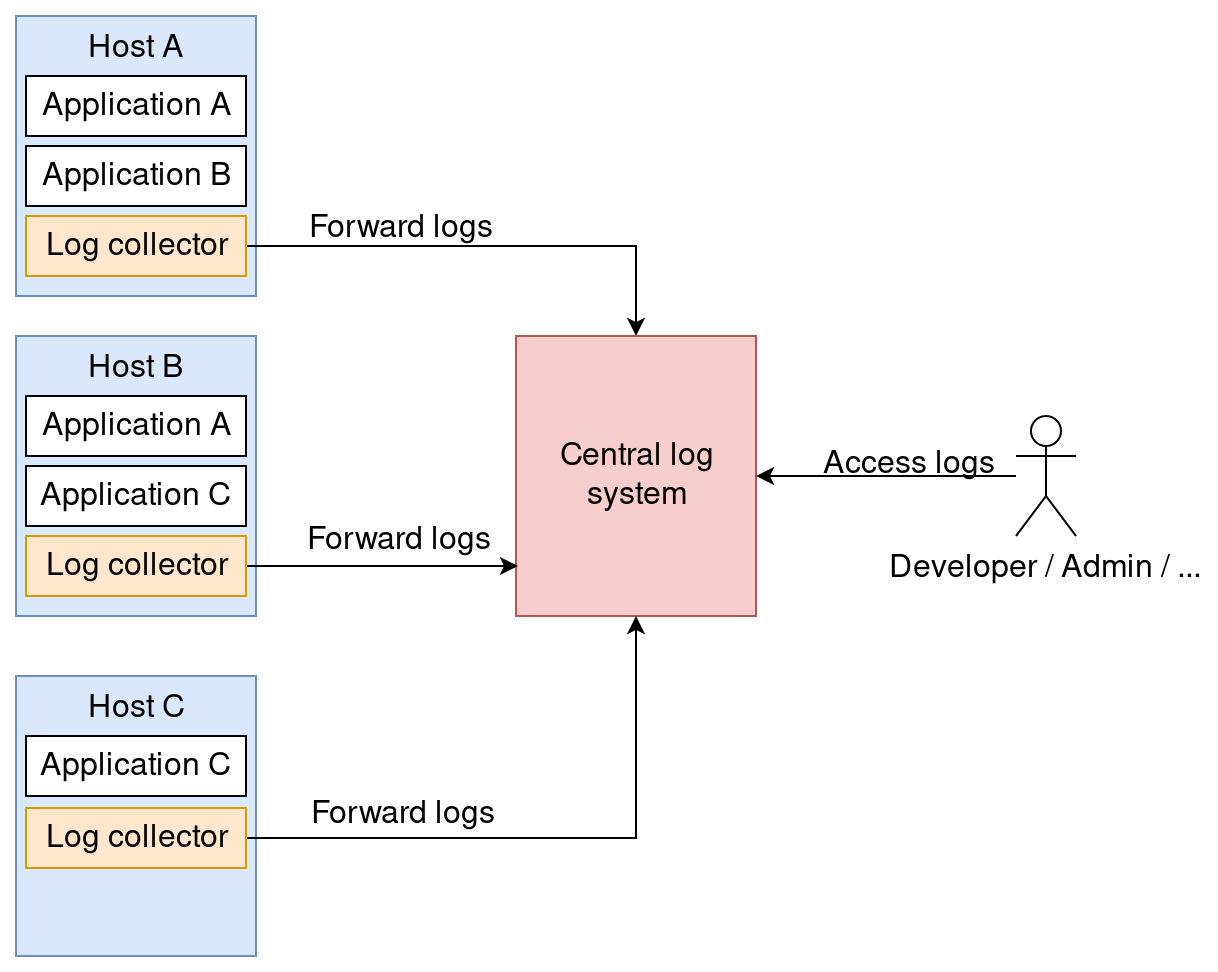
Centralized logging refers to collecting logs of many systems across multiple hosts in one central logging system. With the logs in a common log system, debugging issues with distributed systems becomes a lot easier because the logs can be analyzed efficiently.
In this demo, we collect the logs of only one host, a Kubernetes node, which will be created with Minikube. Minikube is a tool that makes it easy to run Kubernetes locally. It runs a single-node Kubernetes cluster inside a virtual machine.
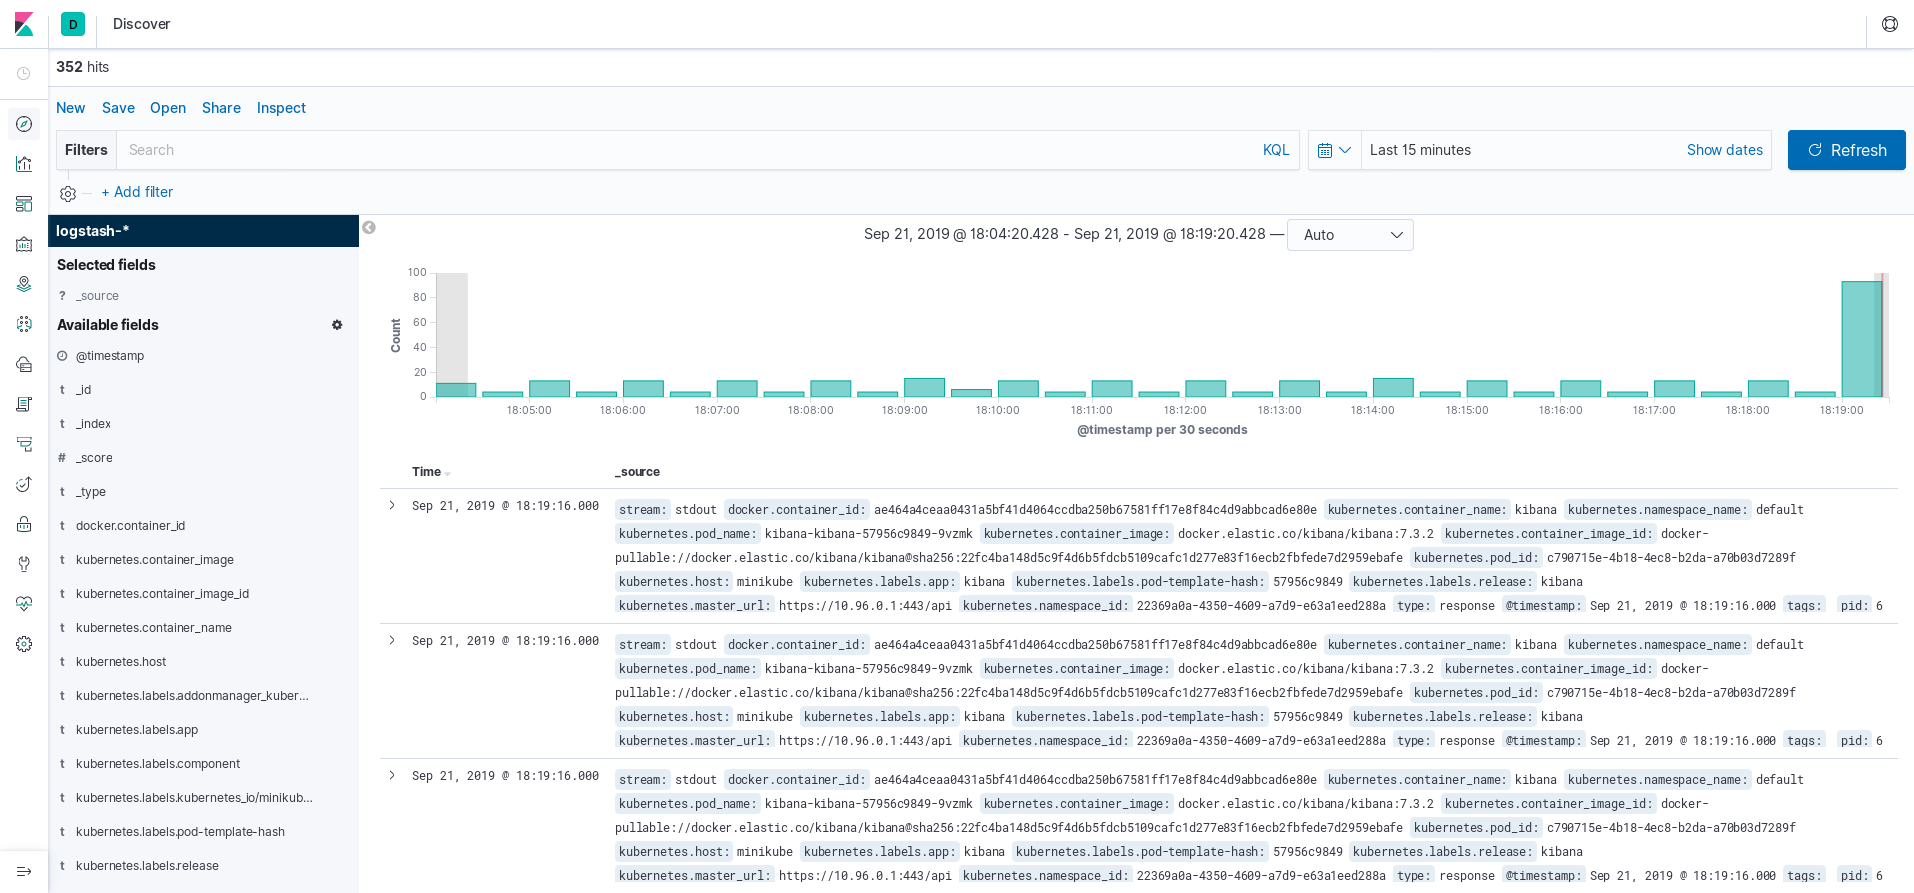
Fluentd is a log agent that runs on each host. The agents collect, parse and forward the logs to Elasticsearch. Elasticsearch is a distributed search and analytics engine by elastic. It is commonly used for full text search use cases. We will use it as our central log system. It stores the logs and provides query capabilities. Kibana is also developed by elastic. It’s a web based graphical frontend that allows querying Elasticsearch, visualizing the query results and creating dashboards. We will use it to query the logs comfortably in a graphical interface.
The goal of this blog post is to create a local lab environment that can be used to experiment with Fluentd, Elasticsearch and Kibana. The setup is completely unsuitable for production usage.
Kubernetes custer setup with Minikube
I use minikube 1.3.1-1 from Arch Linux community package repository in this blog post.
|
|
Helm setup
We will use Helm to deploy Elasticsearch, Kibana and Fluentd on Kubernetes.
Let’s install Helm.
|
|
Elasticsearch setup
Save the Helm chart value overrides to a file named elasticsearch-values.yml.
|
|
Deploy Elasticsearch with the following commands.
|
|
Kibana setup
Deploy Kibana with the following command.
|
|
Fluentd setup
As we want Fluentd to run on each Kubernetes node, it is deployed as a DaemonSet. Save the Helm chart value overrides to a file named fluentd-values.yml.
|
|
Deploy Fluentd with the following commands.
|
|
Kubernetes nodes write all container logs to files in /var/log/. The helm chart configures Fluentd to forward these logs by default.
The volume mounts are defined in this file:
This file contains the Fluentd config including parsing rules:
Access Kibana
Forward traffic to Kibana with the following command.
|
|
Next, go to localhost:5601 to access Kibana. Create an index pattern logstash-* and choose the time filter field name. You can start exploring the logs in the Discover section.
Summary
We created a local Kubernetes cluster with Minikube, installed Helm and deployed Elasticsearch + Fluentd + Kibana with Helm. Have fun playing around with this centralized logging demo.

