Monitoring Batch Jobs with Prometheus
This article will describe how to monitor batch jobs with Prometheus. The defining characteristic of batch jobs is their limited lifetime. Monitoring ephemeral jobs with Prometheus is suboptimal due to Prometheus pull-based architecture. In the worst case, a job might not live long enough to be scraped by Prometheus even once.
The problem is exacerbated by the fact that a job’s outcome is a critical metric. Unfortunately, the likelihood of Prometheus scraping an ephemeral job after it finished it’s task but before it stops existing is low.
The Pushgateway
Prometheus provides a generic solution to this problem which doesn’t compromise it’s pull-architecture: the Pushgateway. The Pushgateway is an additional component which is placed between Prometheus and the ephemeral subjects you want to monitor. The monitored subjects push metrics to a Pushgateway instance where Prometheus can scrape it, even if the monitored subjects don’t exist anymore.

Disadvantages of the Pushgateway
There are some disadvantages when using the Pushgateway.
For instance, no up metric will be available for the monitored subjects that push
metrics to the Pushgateway.
Prometheus can only know if a system is up if it scrapes it because the availability
is deduced from the target being reachable when scraping.
Therefore, there is an up metric for the Pushgateway itself, but not for subjects behind it.
Furthermore, a Pushgateway which caches metrics from many different subjects is a single point of failure which will trigger a barrage of alerts if the Pushgateway fails or becomes unreachable. Lastly, series are not automatically removed from the Pushgateway. Removing obsolete series is the user’s responsibility.
When to Use the Pushgateway?
Because of the disadvantages listed in the previous section, it is important not to misuse the Pushgateway. It is not supposed to be a solution for firewall issues that prevent scraping.
Generally, the Pushgateway should only be used for service-level batch jobs. For example, a Kubernetes cronjob that regularly deletes data of users who requested to be deleted in the context of General Data Protection Regulation - article 17 (“right to be forgotten”) is a service-level batch job. Using a Pushgateway is appropriate in this scenario.
On the other hand, a cronjob that deletes temporary files is not a service-level job. It is associated with a long living subject, the machine it is running on. In this situation, the cronjob’s metrics should be exposed via the node exporter. Node exporter can easily expose metrics of batch jobs with the textfile collector: the job writes it’s metrics into a text file in a certain directory that is monitored by node exporter. Node exporter will expose all metrics from the text files.
Example Code
Next, we will look at an example. The code for the example can be found in this git repository. The included docker-compose file starts Prometheus, a Pushgateway and a simulator which pushes metrics to the Pushgateway. Prometheus is configured to scrape the Pushgateway.
|
|
The simulator is implemented in Python.
For simplicity, it doesn’t use any libraries.
The only tracked metric is the processed_items counter which increases by one every five second.
Metrics are pushed to to the Pushgateway every five seconds:
|
|
The metric is exposed in Prometheus' text-based exposition format:
|
|
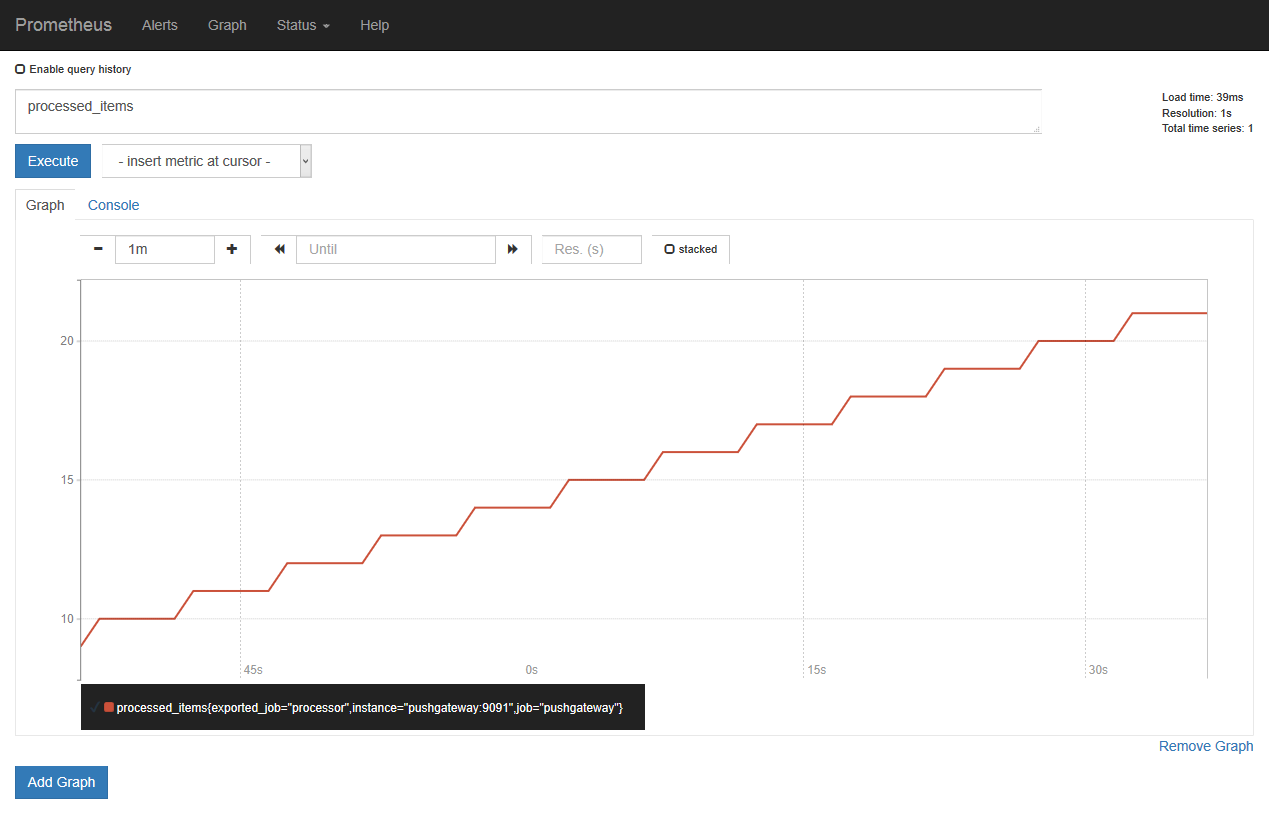
We can verify processed_items ends up in Prometheus through the Web UI which
should be available at http://localhost:9090:
Summary
To summarize, we learned why pull based monitoring is a bad fit for ephemeral batch jobs. The Pushgateway is a solution that allows monitoring ephemeral jobs. It caches metrics of jobs and exposes them to Prometheus. We discussed the disadvantages using a Pushgateway entails and when to use a Pushgateway. Finally, we looked at an example.